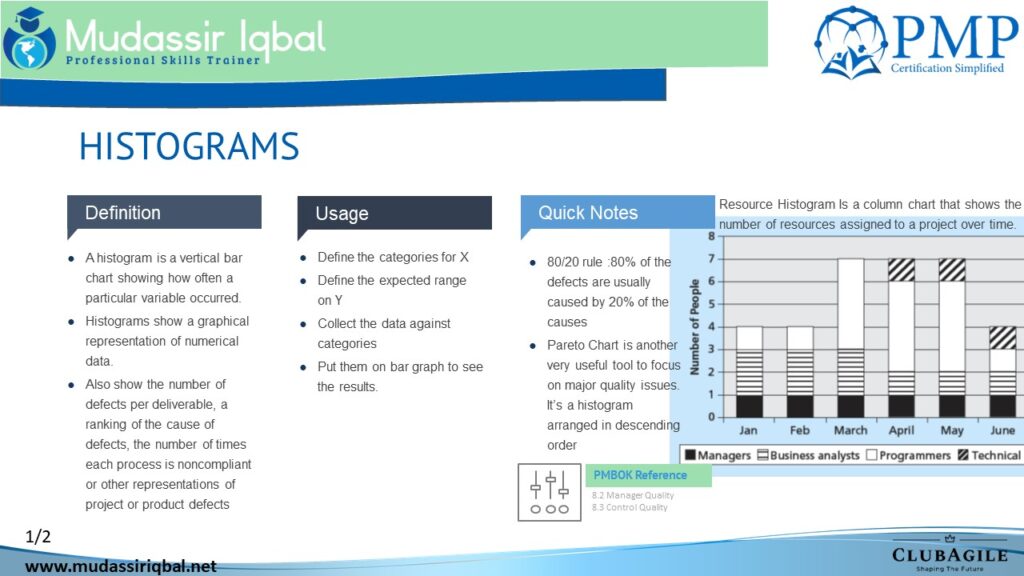
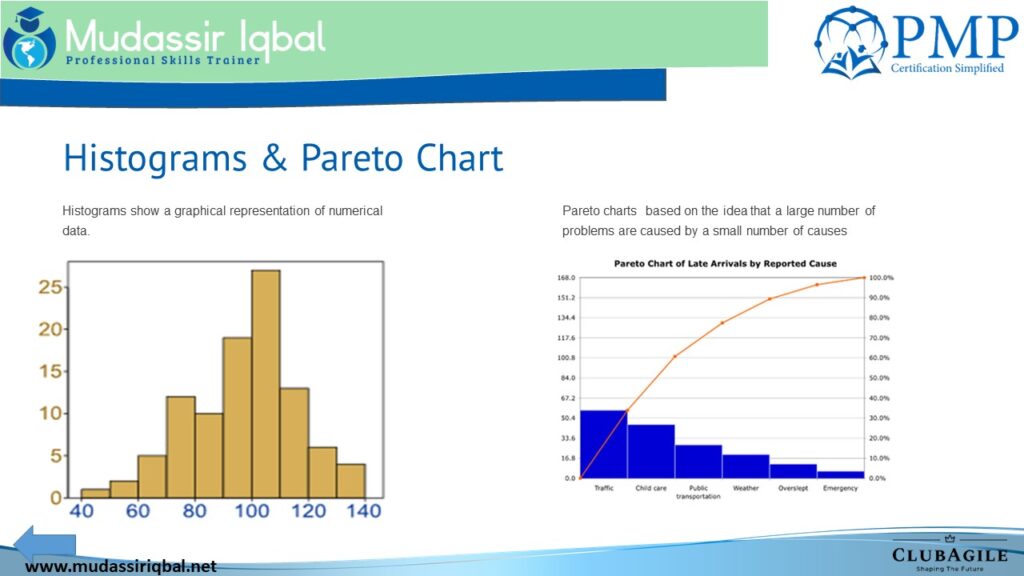
The histogram, the 80/20 rule, and the Pareto chart are all concepts commonly used in project management and quality control.
A histogram is a graph that shows the distribution of a set of continuous data. It is used to visually represent the frequency of data values within a specific range. This information can be used to identify patterns and make informed decisions.

The 80/20 rule, also known as the Pareto principle or the law of the vital few & trivial many, states that 80% of the effects come from 20% of the causes. In project management, this principle is often used to prioritize tasks and allocate resources effectively. By focusing on the 20% of tasks that generate the majority of the results, project managers can maximize their impact and achieve better outcomes.

A Pareto chart is a graphical representation of the 80/20 rule. It is a bar graph that displays the relative frequency or size of problems in descending order of impact. The chart helps project managers identify the most significant problems and allocate resources accordingly.
- The vital few: A small number of sources that account for most of the problem.
- The trivial many: A large number of remaining sources that individually and collectively account for a relatively small part of the entire problem.
Some examples could be
- 80% of complaints come from 20% of customers
- 80% of sales come from 20% of clients
- 80% of computer crashes come from 20% of IT bugs

Examples of the usage of the histogram, 80/20 rule, and Pareto chart
Histogram: Displaying the frequency of task durations in a project to adjust the schedule and allocate resources.
80/20 Rule: Prioritizing tasks with the greatest impact to achieve project goals efficiently.
Pareto Chart: Visualizing the most significant problems in a process to improve quality and efficiency.

